
#husITa18/#SWSD2018: Visualizing Data: Infographics for Teaching and Learning about Social Welfare
 Today is the first day of 2018 Social Work, Education & Social Development Conference in Dublin, Ireland, and my first international social work conference. My first presentation will be with colleagues Nathalie Jones, Melanie Sage, and Todd Sage. We are presenting on the use of infographics in the Social Work curriculum on Friday July 6, 2018 at 10:03 AM in Dobber B of the RSD. This blog post does a few things. First, it offers an example of infographics as a tool for improving digital literacy with social work students. We also provide copies of all the presentation slides and handouts. Finally, this post helps us share and better disseminate our research findings.
Three of us (Nathalie, Melanie & Laurel) have been using infographics as an assignment in our classrooms for several years and have even collected some data across our universities to ask students about the pros and cons. Guess what? The students overwhelmingly love infographic assignments. They appreciate working their creative muscles, like the opportunity to learn a new and transferable skill, and say they’ll use infographics again. Also, the technology can be a little bit frustrating, and some students are uncomfortable with the lack of structure. We argue that it’s good for students to sometimes get uncomfortable with lack of structure- this experience of managing some ambiguity is an important practice skill, as we know well!
We have shared this work in a variety of ways with our colleagues (from conferences to listservs & Twitter to water cooler conversations) in the US and are excited to bring infographics to an international conference. In a previous blog posts, we offer assignment details and even rubrics you can use to build your assignments if you are a social work educator. We share these in the spirit of service to our profession and to support your work. Here are links to these posts:
– #BPDNOLA17 – Visualizing Data: Infographic Assignments across the Social Work Curriculum: This post includes copy of the infographic assignment and links to tutorial videos.
– Teaching with Infographics: My experiences with digital literacy and non-traditional students: In this post, Nathalie provides details about how she incorporated infographics into her classroom.
Below you’ll find our conference proposal and a link to our slides. We’d love it if you joined us on Friday, July 7th and shared your comments and experiences about using infographics in the classroom.
Reflection Questions for Digital Literacy in Social Work
This post was written and edited by Nancy J. Smyth, Melanie Sage, and myself. It will be included in our forthcoming book, Teaching Social Work with Digital Technology, to be published by CSWE Press in 2018.
 Given the complexities of digital and social technology in today’s world and its effects on individuals, communities, and organizations, we argue that social work educators should teach students a holistic literacy of technology to promote, digital literacy, that is, the skills and knowledge to use information and communication technologies (ICTs) to find, critique, create, and share content (Heitin, 2016). Many websites have assessments that purport to assess one’s digital literacy. However, upon closer look, it is clear that they are often very dependent on the context of the technologies discussed such as a specific type of software, web-based application or mobile device. A good example of this in higher education is when we teach students to use a learning management system (LMS) like Canvas or Blackboard and focus only on how to upload a document within the LMS without helping them understand that the skill of uploading applies to many web-based platforms. By using digital literacy assessments with such a narrow focus, it means they become obsolete quickly and are not relevant to all contexts such as how features of an app may look different on a smartphone compared to a laptop.
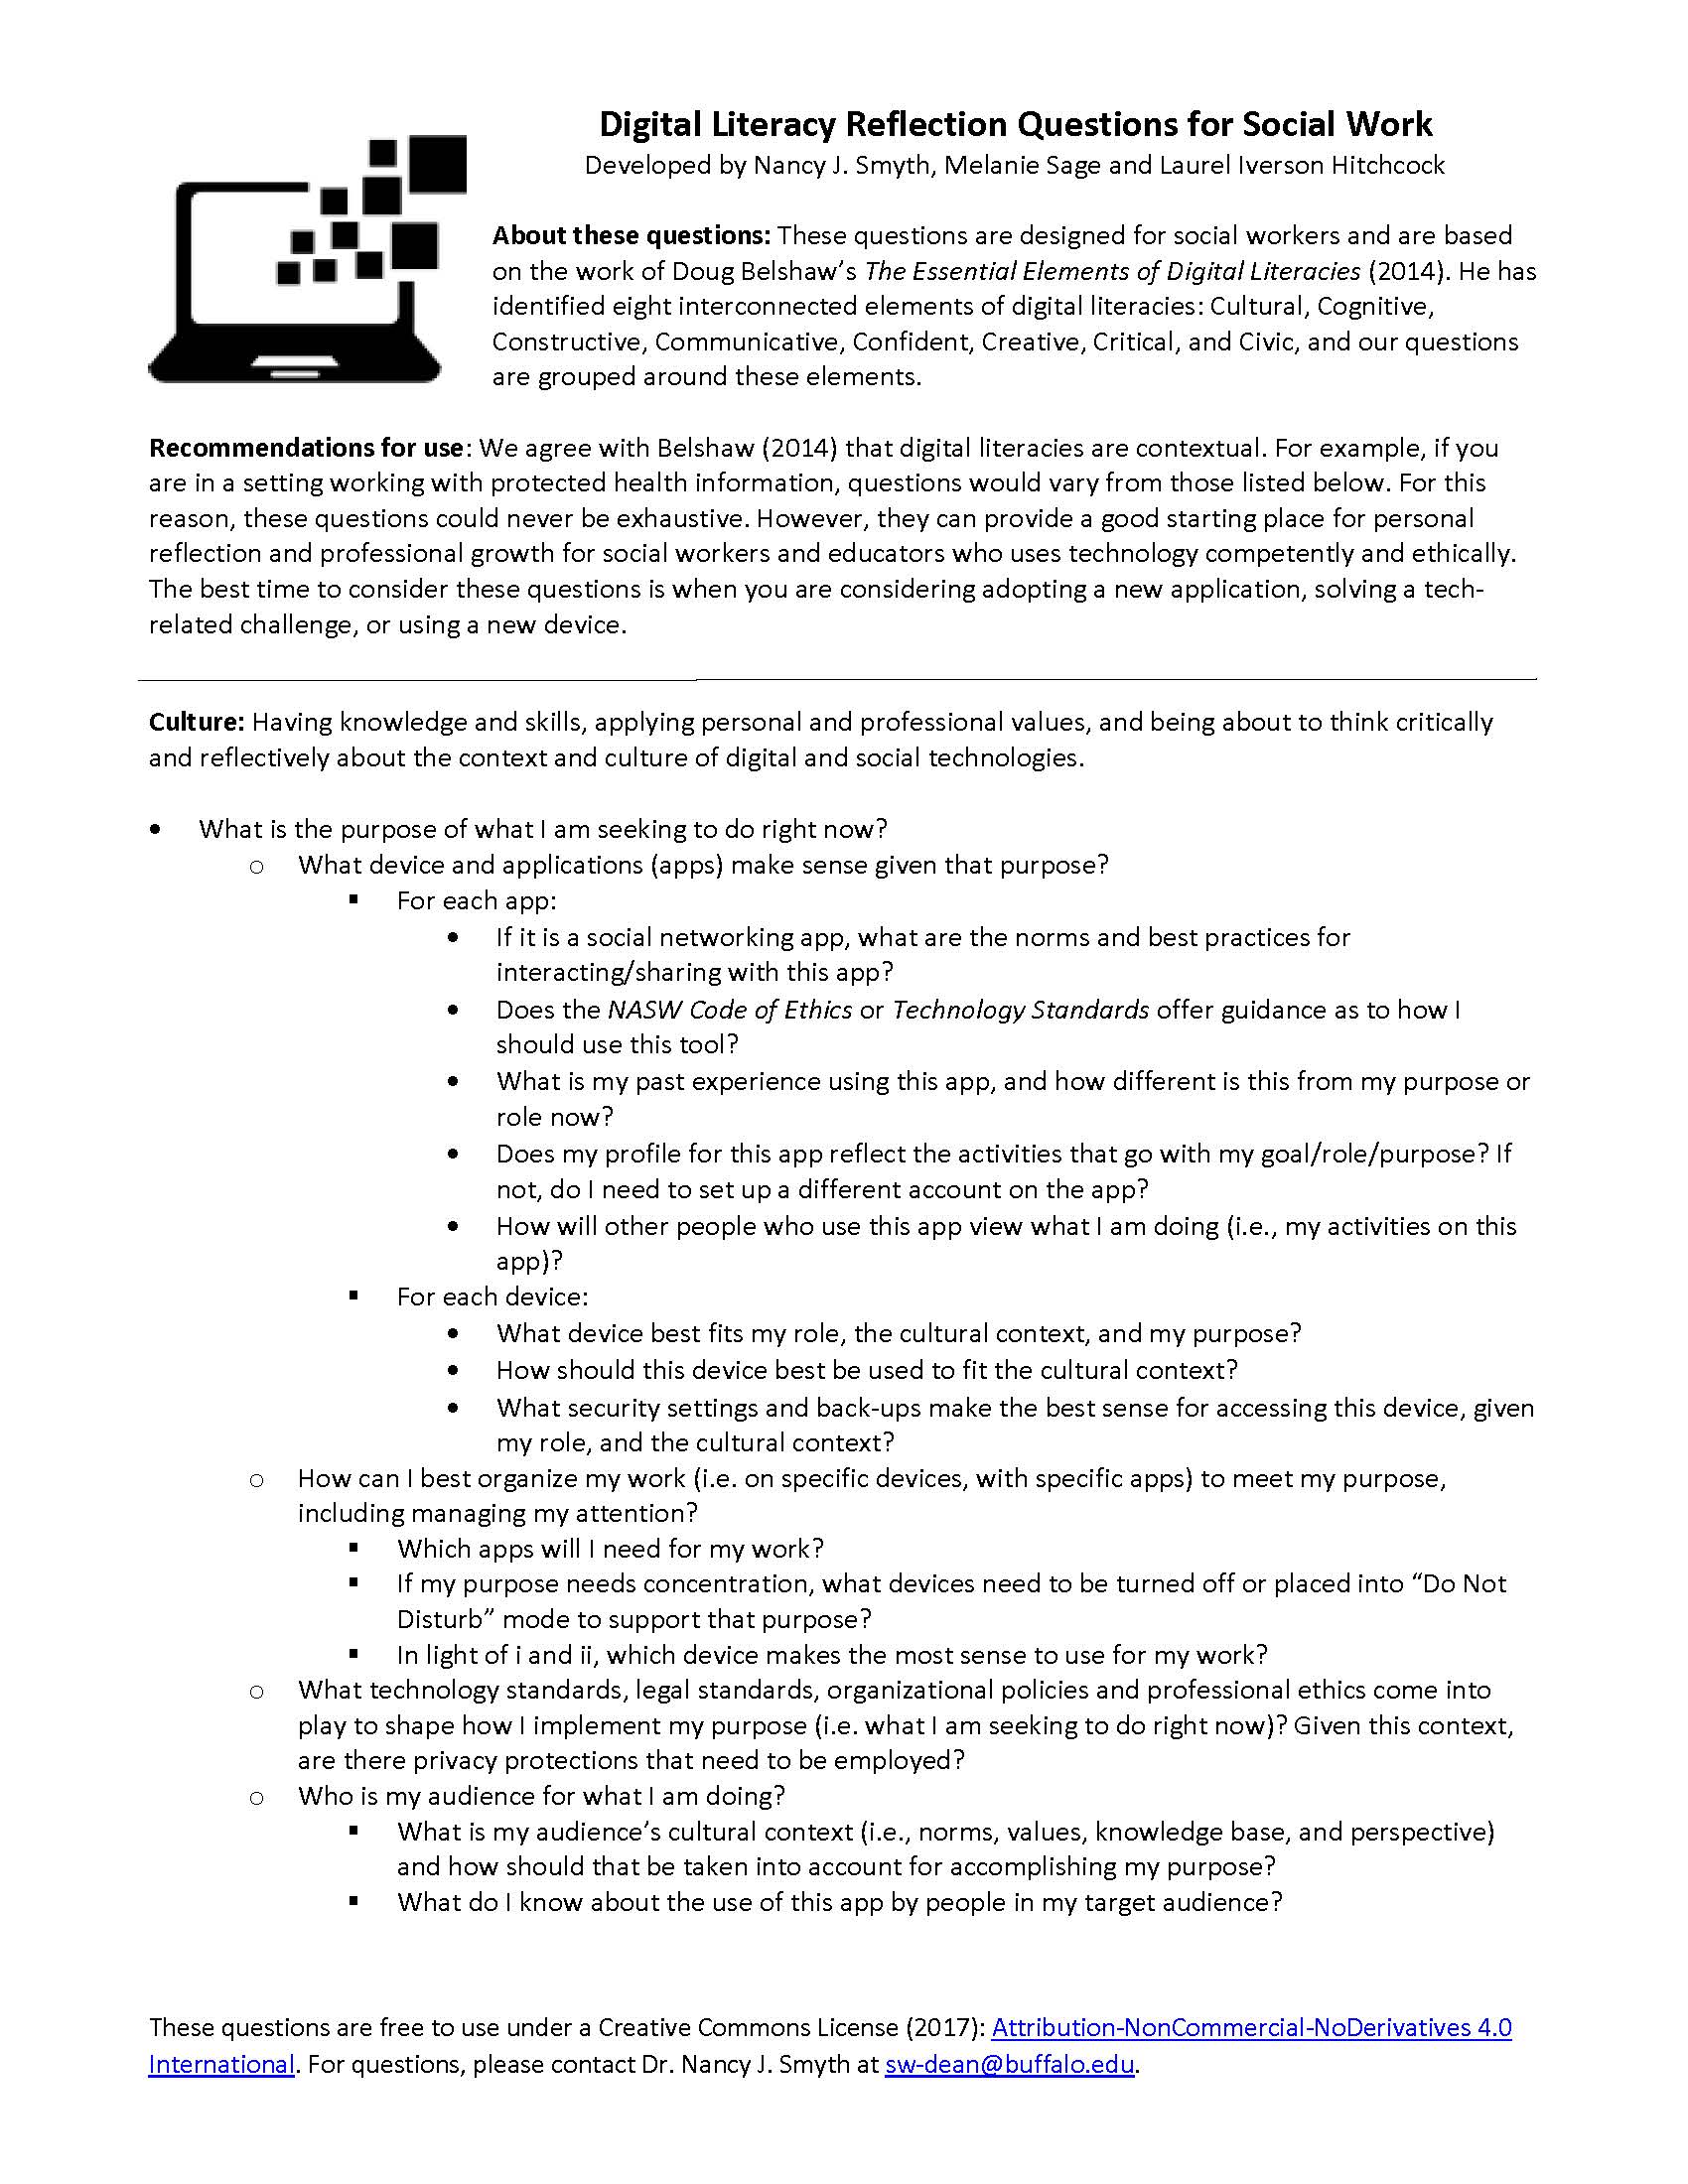
To help social work educators and practitioners understand their own digital literacies more deeply as well as help others such as students or workshop participants, we are presenting some questions that serve as a starting point for reflection as you consider teaching with technology, as well as helping students enhance their digital literacies. These questions are grounded in the work of Doug Belshaw and his book The Essential Elements of Digital Literacies. He has identified eight interconnected elements of digital literacies: Cultural, Cognitive, Constructive, Communicative, Confident, Creative, Critical, and Civic, and our questions are grouped around these elements. Here are some brief definitions of each element with some sample reflection questions for each element (a handout with all the questions is available later in this post):
#SW2018 Visualizing Data: Infographic Assignments across the Social Work Curriculum

Right to Left: Laurel, Nathalie & Melanie
This year at the 4th Annual Social Work Distance Education conference, Nathalie Jones of Tarleton State University, Melanie Sage of the University at Buffalo and I presented on the use of infographics in the social work curriculum. This blog post does a few things: 1) it offers an example of infographics as a tool for improving digital literacy; 2) it offers a sample of what a hands-on conference workshop proposal looks like, and; 3) it helps us share our research.
The three of us (Laurel, Nathalie, Melanie) have been working together on polishing our infographic assignments for a few years. In a previous blog post, we offer assignment details and even rubrics you can use to build your assignments if you are a social work educator. We share these in the spirit of service to our profession and to support your work.
We’ve been using infographics as an assignment in our classrooms for several years and have even collected some data across our universities to ask students about the pros and cons. Guess what? The students overwhelmingly love infographic assignments. They appreciate working their creative muscles, like the opportunity to learn a new and transferable skill, and say they’ll use infographics again. Also, the technology can be a little bit frustrating, and some students are uncomfortable with the lack of structure. (We argue that it’s good for students to sometimes get uncomfortable with lack of structure- this experience of managing some ambiguity is an important practice skill, as we know well!)
Here are the slides from the presentation:
Course Mapping for Online Social Work Courses
 This post was written by Denise Krause, clinical instructor at the School of Social Work at the University at Buffalo, and edited by Nancy J. Smyth, Melanie Sage, and myself. It will be included in our forthcoming book, Teaching Social Work with Digital Technology, to be published by CSWE Press in 2018.
Course mapping is considered a best practice when designing any course content for online delivery via a learning management system (LMS) (Jacobs, 2004; Quality Matters, n.d.; Wiggins & McTighe, 2005). need date; more references). It is the process of aligning the course objectives with module objectives and all learning activities in a course to create a visual overview of the course. In turn, these documents can be used to create a student roadmap, which provide clear directions on how students can navigate online course content in a consistent and methodical way. This helps to ensure that student will avoid missing instructions assignments. Roadmaps can be used in any type of online course from a web-enhanced offering to a fully online class. What goes into a student road map will vary by instructor and/or institution, but key topics include learning objectives, course content, assignments or learning tasks, and assessments.
Social Work Distance Education Assessment of Readiness Checklist (SW-DEAR)
This post was written and edited by Nancy J. Smyth, Melanie Sage, and myself. It will be included in our forthcoming book, Teaching Social Work with Digital Technology, to be published by CSWE Press in 2018.
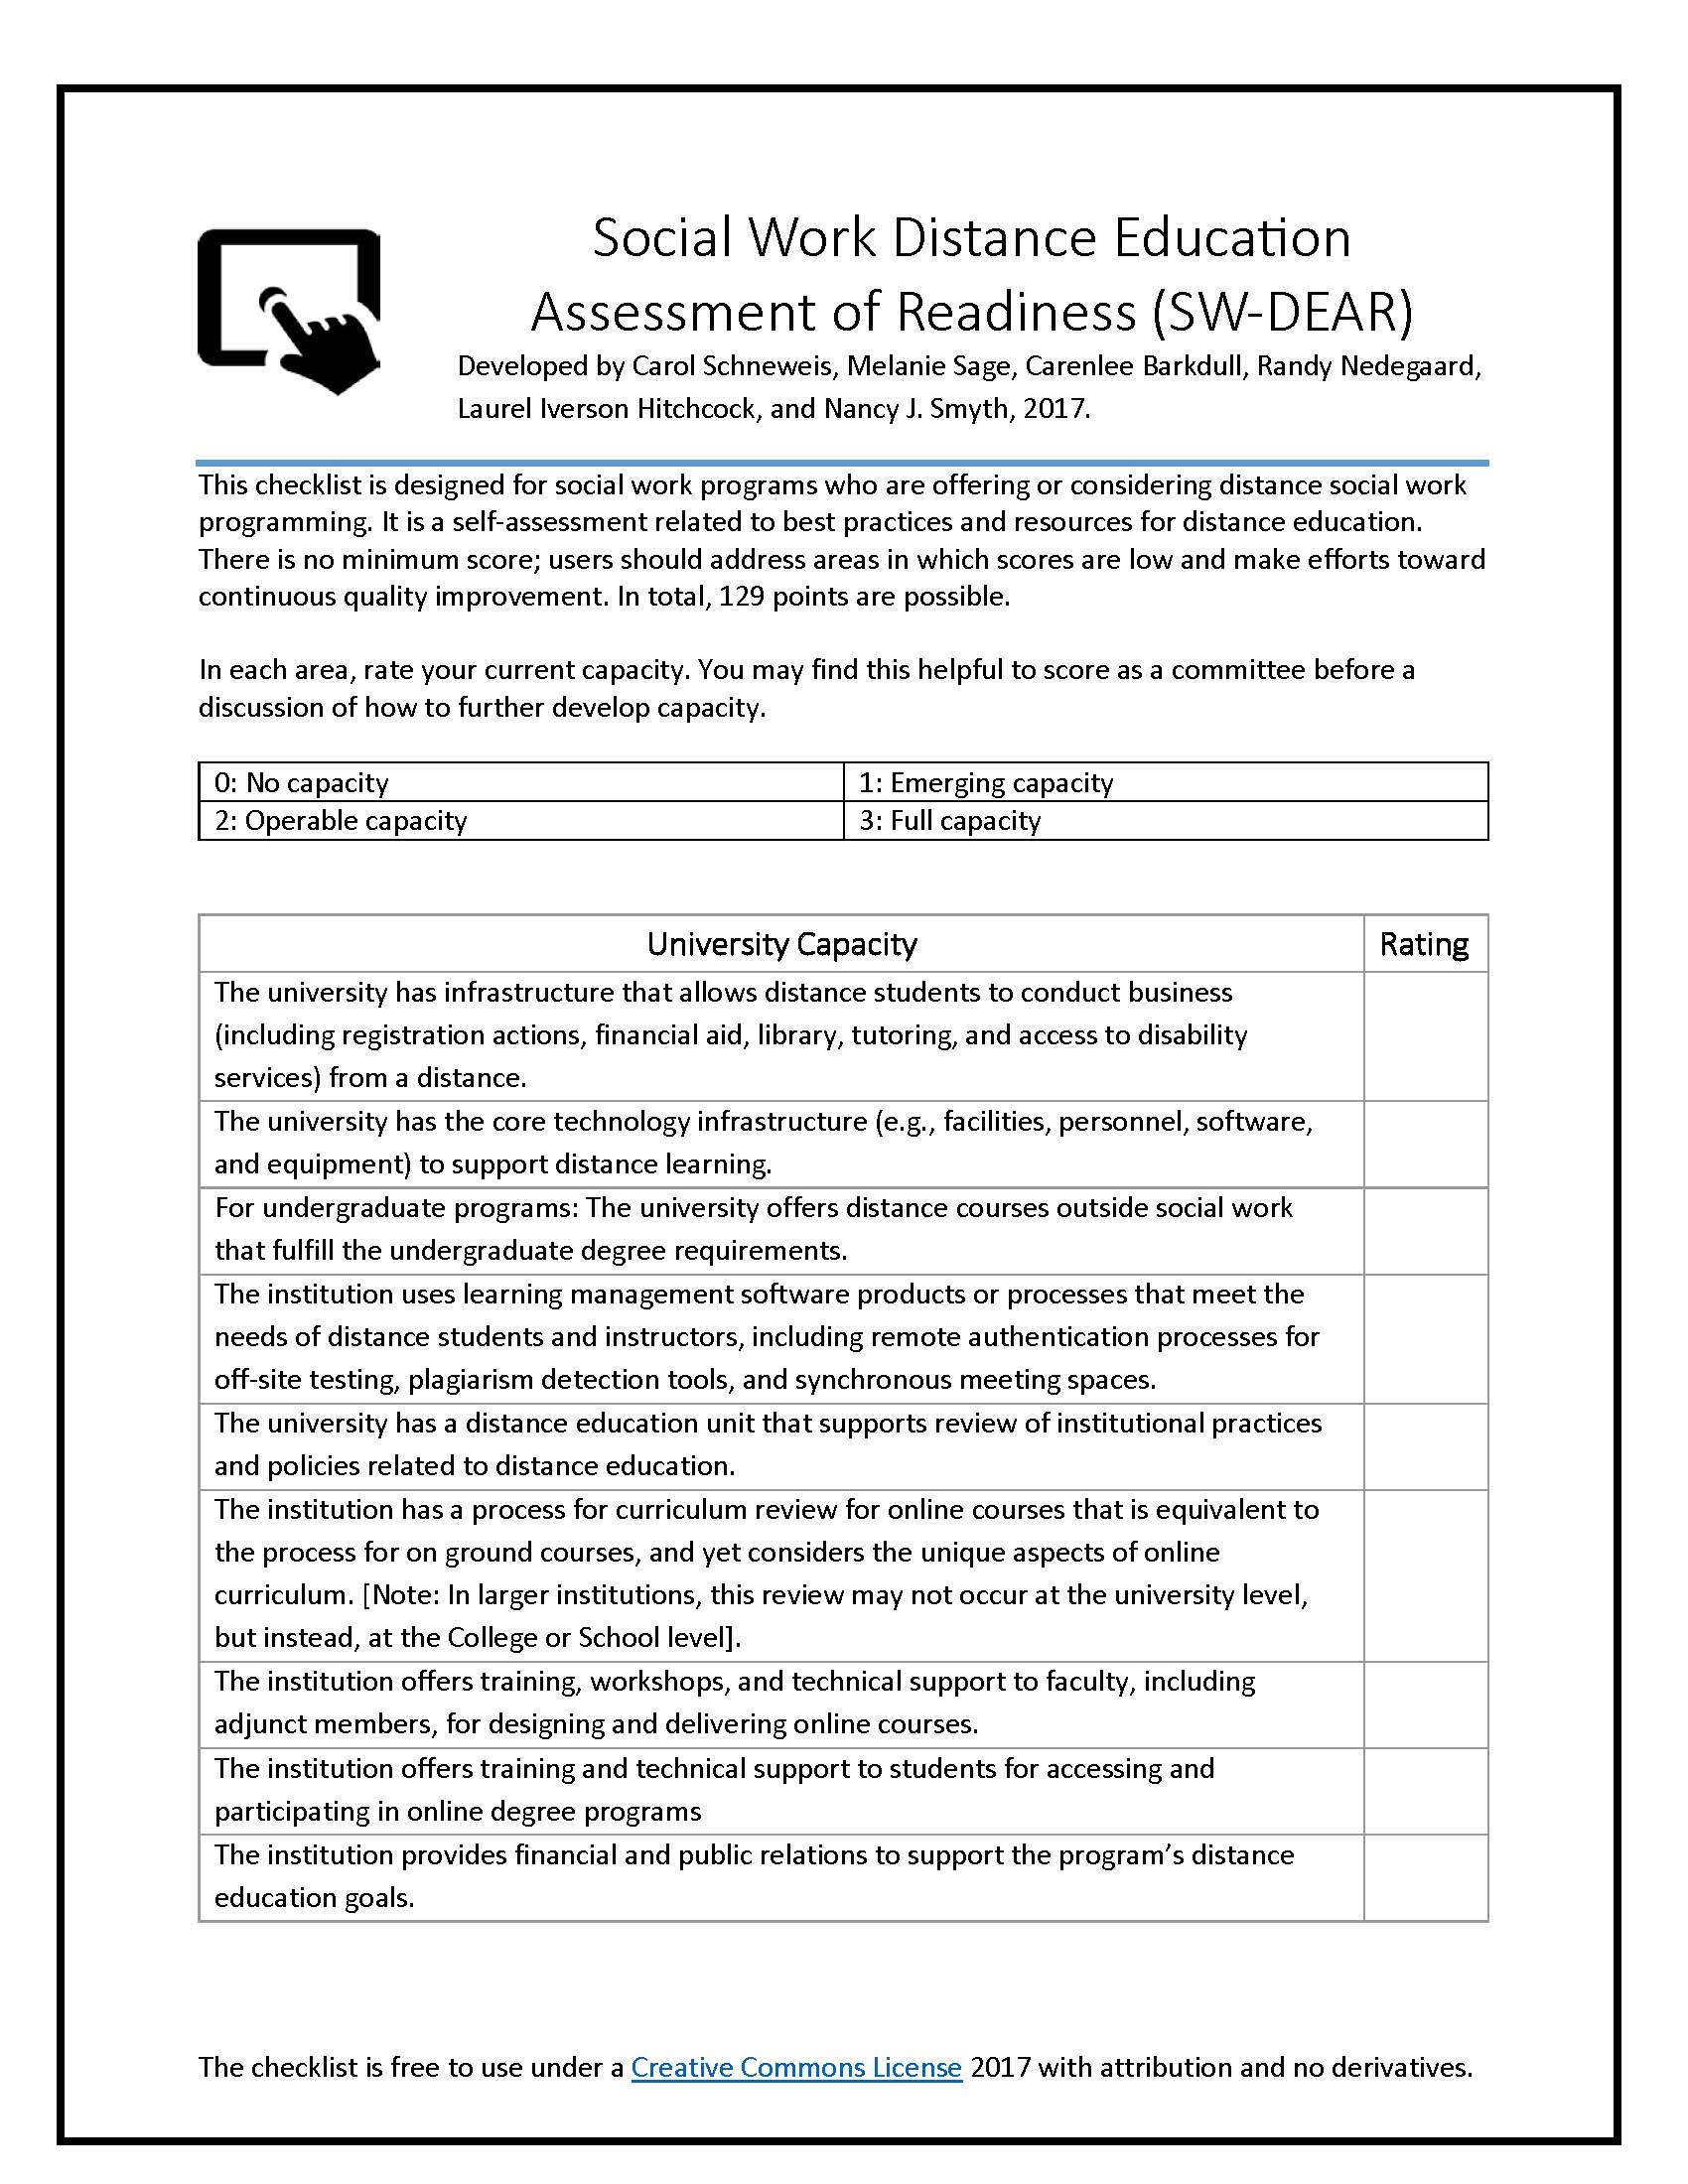 Social work programs develop online social work programs in different ways – converting courses overtime until the entire curriculum is online; launching designated online cohorts; insourcing (hiring faculty to teach online); or outsourcing (hiring an outside firm to put your program online), including varying degrees of faculty autonomy in developing and teaching an online courses. Regardless of the approach, a first step in the process is assessment of a social work program’s readiness for online programming, and a reason for a struggling online program often has to do with stretched capacity. Many campus-wide issues must be considered before launching any type of fully online programming. These considerations include the ways in which online programming makes education more, or less, accessible to different populations of students, gatekeeping concerns, and implicit curriculum issues. To help social work programs consider capacity issues related to online programming, we have collaborated with the faculty members Carol Schneweis, Carenlee Barkdull, and Randy Nedegaard at the University of North Dakota’s Department of Social Work to develop the Social Work Distance Education Assessment of Readiness Checklist (SW-DEAR) which programs can use to assess readiness to launch online programming, and identify opportunities to strengthen current programming.
This checklist is a self-assessment related to best practices and resources for distance education. The assessment includes 43 items that cover the following areas of capacity:


Teaching & Learning in Social Work by Laurel Iverson Hitchcock is licensed under a Creative Commons Attribution-NonCommercial-ShareAlike 4.0 International License