
Teaching with Infographics: My experiences with digital literacy and non-traditional students

Nathalie P. Jones, PhD, MSW
Nathalie P. Jones, PhD, MSW is an Assistant Professor of Social Work at Tarleton State University. In this blog post, Dr. Jones writes about her experiences creating and implementing an infographic assignment with nontraditional social work students.
As an Assistant Professor of Social Work at Tarleton State University, I have absolutely enjoyed educating social work students on the use of technology through macro social work practice courses. I teach a large number of non-traditional learners (those who have been out of school for longer than one year, and are employed, parenting, or in any other roles that are competing with being a learner as defined by the National Center for Education Statistics [2015]). I find that they develop student groups quickly in order to have support while working on assignments, especially those assignments that include the use of digital technology.
To help my students improve their understanding of digital and social technology, I have introduced the use of infographics during an advanced social work course entitled Women’s Issues. Infographics are visual representations of almost any type of information. Infographics are similar to storytelling with visual content and supported with statistical data. They are an effective way to communicate large amounts of information in a clear and succinct way, and are an increasingly popular tool in popular media and the non-profit world (NonProfit Tech for Good, 2014). Understanding how to create, share and evaluate infographics is a key digital literacy skill for social workers (Shelly, 2015). Along with all these benefits, I wanted to create an assignment that was fun and engaging for my nontraditional students who are often nervous about nontraditional, digital assignments.
For the Women’s Issues course, I asked students to research an issue or social problem affecting women, turn that research into an infographic (rather than a written paper), and then share their infographics with professionals outside of the class as a way to network with alliances who advocate on behalf of women. This meant students needed to not only create a quality artifact for a grade, but also learn how to share it with other advocates in a public way – via social media. In an effort to support learners who were experiencing technology in college for the first time, I provided them with seven detailed steps to successfully complete the infographic assignment. These steps involved learning about Twitter as well as creating an infographic.
Here are the assignment steps directly from the course syllabus:
Step 1: Create a Twitter Account & provide your Twitter Handle. *Don’t forget to follow the instructor.
Step 2: Research & provide a resource of two infographics (1) from the web and (1) from Twitter related to Women’s Issues. Then, provide a 1-2 page comparison on how the infographic was distributed, what was learned & why this is a resource for issues related to women.
Step 3: Create a FREE Infographic Account (all group members), provide evidence (screen shot) that this account has been created. After reviewing the tools in your new account, complete a draft storyboard of your infographic including text and images. Consider what your message might be and how you will use images for the creation of the infographic.
Step 4: Critique an infographic based on an issue related to women: This should include: One-Two page summary on what was learned, critique it by providing why this is a resource and what does this cover and why is it relative to social work? (Ex.) Could be Agency, University or Organization.
Step5: Submit a draft of your infographic.
Step 6: Submit Final Project (Blackboard) & Tweet this infographic tagging the Agency/Organization that you’ve identified that would be interested in this infographic topic due to the population served.
Step 7: Complete the Reflection Assignment. Write a 200-250 word reflection on how the infographic was created, what was learned, what were the strengths and limitations of this assignment, and how using infographics could impact your future as a social work practitioner.
For the course, I created a hashtag (#TSUSOCWSU15) to help students share their infographics via Twitter. Using a course hashtag allowed me and other students in the class to quickly search for all the infographics. For more information about hashtags on Twitter, check out this article from the Twitter Help Center.
Some of the students experienced a large amount of anxiety the first time this assignment was introduced to the class. For instance, the energy in the classroom shifted and there was a sense of anxiety that filled the air. Students were yelling out and having side conversations until I mentioned that we would end class early for individual meetings to address questions on the assignment. Also, to help reduce their concerns, I provided the following resources: Social Worker’s Guide to Social Media (University at Buffalo School of Social Work (n.d.); a blog post by Dr. Nancy J. Smyth titled Twitter 101 (2013); and suggested infographics on Pinterest about emotional support and increased confidence. Although, I moved cautiously on introducing this assignment, several students were still confused, and did not feel confident in their abilities until the fifth step. For example, students were not familiar with various terms such as hashtag (#).
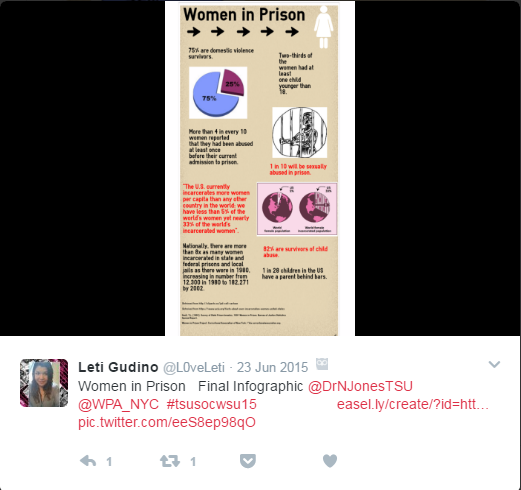
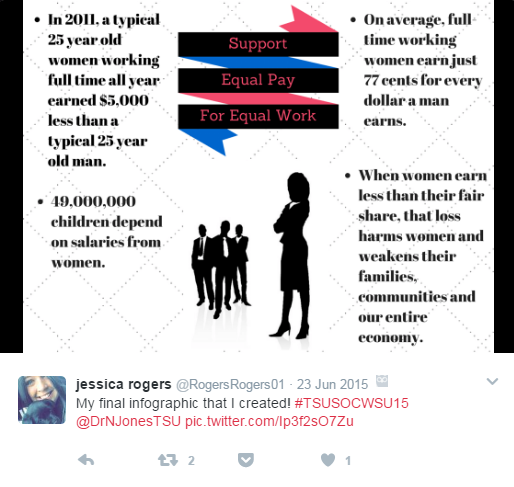
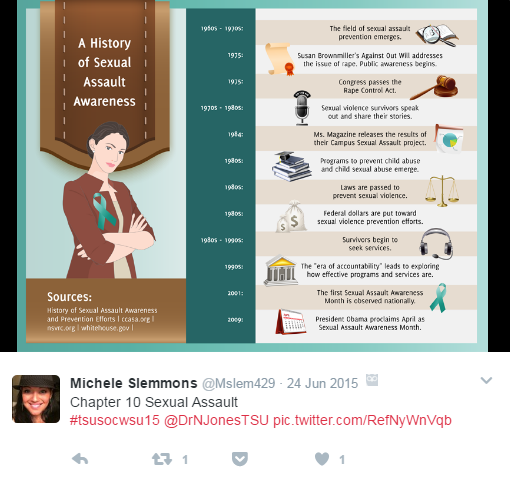
By the end of the semester, students had produced quality infographics on topics ranging from Women in Prison to Equal Pay. Here are some examples of infographics from that first class:
To grade the assignment, I used a basic rubric that assessed content (specific to Women’s Issues), grammar, use of the APA writing style guidelines, visual representation of data, and implications for social work.
Overall, students reported a positive learning experience with the assignment. Here are some of their comments:
-“Learning about info graphs has been a very new experience for me. This experience has been pleasant and most defiantly an adventure.”(L1)
-“I found that making infographics is an exciting and fresh way to deliver information to potentially large audiences.” (L2)
-“I’ve learned that Infographics help social workers to advocate for an issue, while at the same time, educating audiences about the issue and why it is important.” (L3)
-“The use of infographics has helped me to see that there are visual methods of sharing information. Also, I had fun making my infographics.” (L4)
There were several challenges with the assignment that first semester. First, it was introduced in an online course. Therefore, sitting down and walking through the steps with students was not an option. Also, the instructions on the assignment needed to more detailed. Finally, students struggled without the visual aspects that could have been provided inside of the learning platform (Blackboard).
Due to our large number of nontraditional learners, there was a need for additional support to this assignment. It was apparent that additional support was necessary to increase the students’ comfort level of technology use and improve the clarification of each step within the assignment. I have modified how I engaged students with the assignment in the following ways:
• I have provided additional tutoring time on the technology.
• Additional support was set up from our center for instructional innovation to assist learners with issues outside of class.
• I have added more discussion (to highlight challenges or success stories) time during class to provide suggestions and guidance.
• I ask learners to provide feedback on steps to improve the assignment for future courses that will have infographic assignments such as this.
I have also added the following modifications to this assignment:
• Require Citations
• Require Statistics
• Shortened the Hashtag
• Require Additional Drafts
• Shortened the Hashtag
• Add learners to a list on Twitter
• Simplified the steps for the assignment
• This is an individual assignment rather than group
• Require Advocacy/Prevention or Awareness focus
• Require identification of specific implication(s) for social work
• Class discussions (pertaining to infographics & social work practice)
Due to the rapid use of technology and social media in the 21st Century, social work learners need to acquire this skill that combines advocacy and technology use. My teaching philosophy consists of empowering learners to build a toolbox that will assist with such advocacy effectiveness. In an efforts expand my knowledge and application of integrating technology in social work education, I have been able to partner with some of my colleagues, Melanie Sage at the University of North Dakota and Laurel Hitchcock at University of Alabama at Birmingham. Together, we are partnering in the use of technology, such as the use of infographic assignments, across the social work curriculum.
References:
NonProfit for Good. (2014). 5 Trends in Nonprofit Infographic Design. Retrieved from: http://www.nptechforgood.com/2014/04/05/5-trends-in-nonprofit-infographic-design/
Shelly, P. (2015). The Big Picture: Infographics for Social Work. Retrieved from: https://socialworksynergy.org/2015/09/15/seeing-the-bigger-picture-infographics-for-social- work/
University at Buffalo School of Social Work. (n.d.). Social Worker’s Guide to Social Media. Retrieved from: http://socialwork.buffalo.edu/resources/social-media-guide.html
Smyth, N. (2013). Twitter 101. Retrieved from https://njsmyth.wordpress.com/2013/07/19/twitter-101/
National Center for Education Statistics (2015). Demographic and Enrollment Characteristics of Nontraditional Undergraduates: 2011–12. Retrieved from http://nces.ed.gov/pubs2015/2015025.pdf
How to cite this post:
Jones, N.P. (2017, February 24). Teaching with Infographics: My experiences with digital literacy and non-traditional students [Blog Post]. Retrieved from: https://laureliversonhitchcock.org/2017/02/24/jones_infographics/