Harnessing Social Media for Social Good at #CG4SW
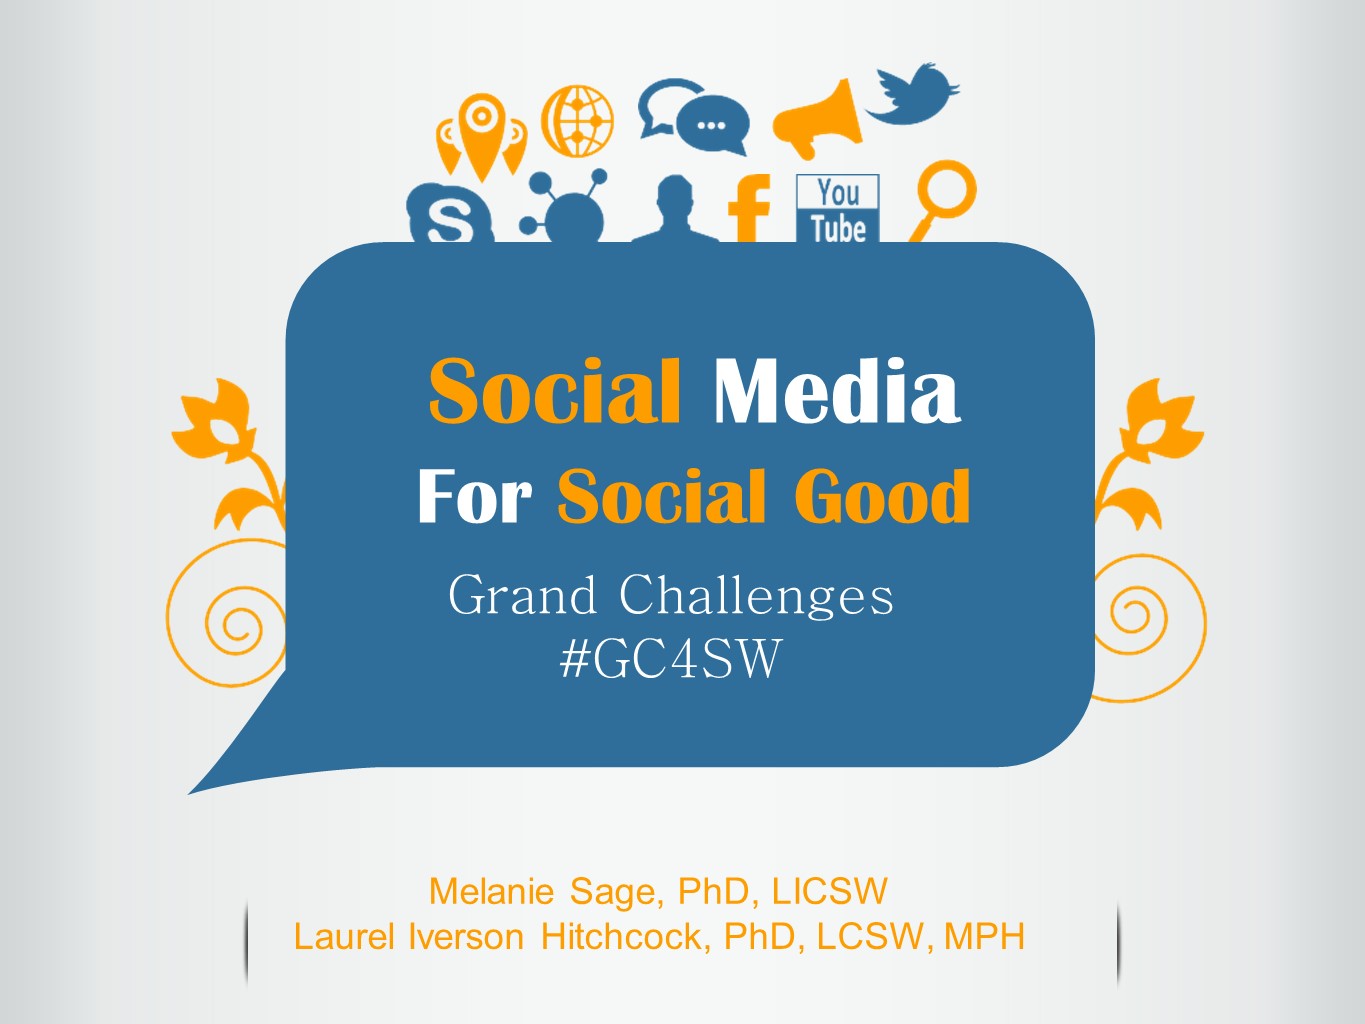 Last week, Melanie Sage and I led a discussion at the Social Work’s Grand Challenge Initiative Conference (#GC4SW) held at the University of Southern California (April 25-28, 2017). We attended the last day of the conference, which focused on for Harnessing Technology for Social Good. If you are not familiar with this challenge, its focus includes leveraging digital and social technologies to enhance, improve, and expand the reach and influence of social services, evidence-based social work practices, and innovative programs. Two white papers outline how social work can use technology to help individuals, communities, and organizations:
The use of social media is omnipresent in our daily lives, and ahead of policy and ethics in social work. Technology policy standards typically do not address concerns of social workers, including communication with clients, and professional values of privacy and confidentiality, safety, and self-determination. As a profession, we have few research studies about the use of social media in practice and mixed professional guidance around how to best engage with social media as part of our work with clients, constituents, and communities. Some in social work take a risk-averse approach to social media, limiting how and who they interact with on virtual platforms such as Facebook, Twitter, and Instagram. However, this Grand Challenges supports broader thinking and creativity in how social workers can engage with social media, especially to address the 11 other grand challenges.
As part of our discussion, we proposed that social media can be a tool to help social work academics and practitioners to discover and share knowledge as well as build relationships for collaborative work. Social media platforms are well-placed to allow social workers across the professional continuum to engage with each other, creating communities of learning and practice that bridge the gap between practice and research in social work. We suggested four practices with social media for advancing the Grand Challenges for Social Work:
Day Two of #SWDE2017 – Professional Learning Networks for Social Work
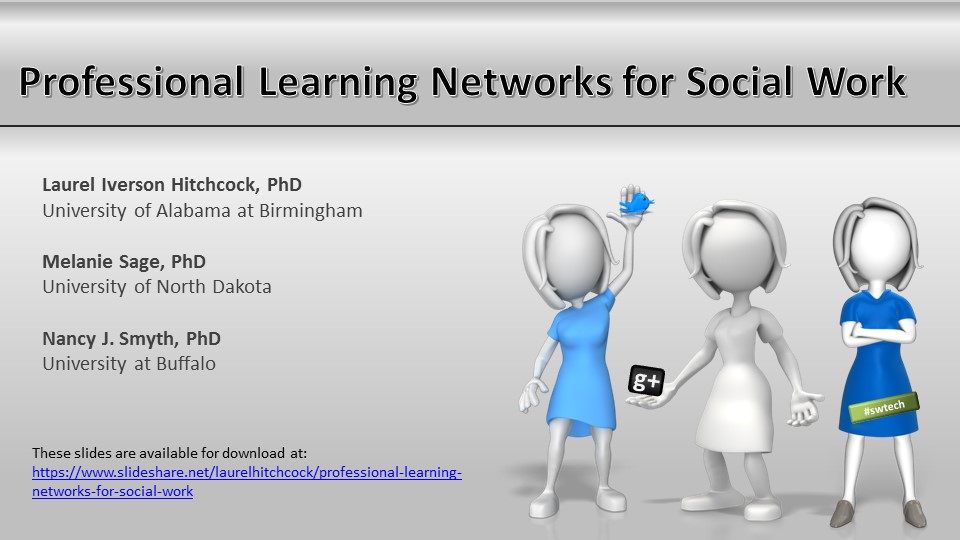 On April 13th, Melanie Sage, Nancy J. Smyth and I presented at the third annual Social Work Distance Education Conference sponsored by Our Lady of the Lake University’s Worden School of Social Service.
Our workshop informed participants about the mechanics as well as the advantages and disadvantages of professional learning networks (PLN), both as a scholar and in the classroom. A professional learning network (also known as a personalized learning network) includes technology-based tools and processes used by a social worker to stay up-to-date and share information about current news, practice knowledge, and the latest research findings. Participants learned how to establish and grow their own PLN, integrate PLNs into a classroom or curriculum, and appreciate how the theory of Connectivism (Siemens, 2005) informs the practice of PLNs.
You can access a copy of the slides here: https://www.slideshare.net/laurelhitchcock/professional-learning-networks-for-social-work.
A copy of the Professional Learning Network (PLN) Worksheet shared during the session is available here: https://drive.google.com/file/d/0ByR_E-iQH7PdT2t1WV9YYnlZV00/view?usp=sharing
Day Two of #SWDE2017 – Integrating Technology-rich Assignments in the Curriculum
 From April 12-14, 2017, the third annual Social Work Distance Education Conference was sponsored by Our Lady of the Lake University’s Worden School of Social Service in San Antonio, TX.
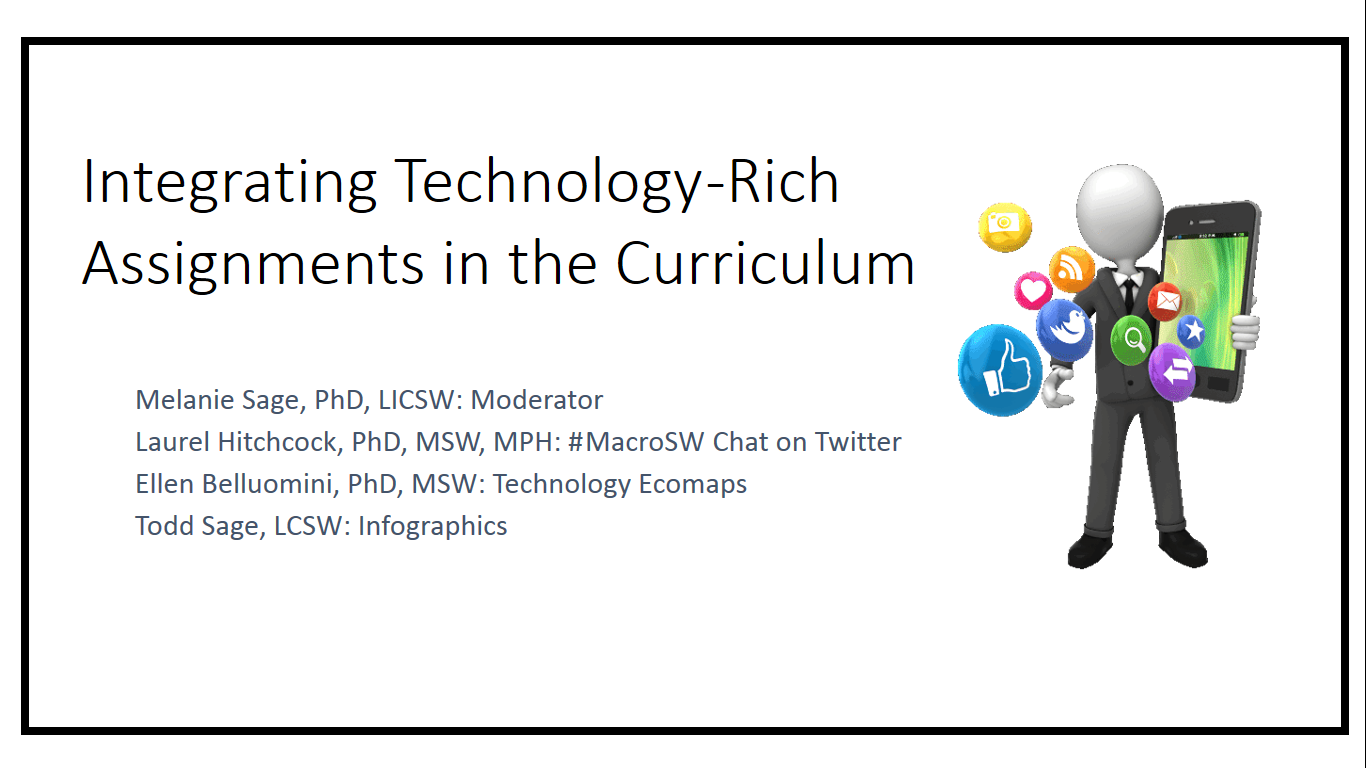
Melanie Sage & Todd Sage of the University of North Dakota, Ellen Belluomini of Dominican University, and I participated in a panel discussion about incorporating technology-based assignments in the social social work curriculum. We talked about three different types of technology-based assignments that can be incorporated into almost any classroom: Twitter Chats, Technology Assessments, and Infographics.
You can access a copy of the slides here: https://www.slideshare.net/laurelhitchcock/integrating-technologyrich-assignments-in-the-curriculum. We also have some assignment specific resources:
#BPDNOLA17 – The Social Media Toolkit goes on the road
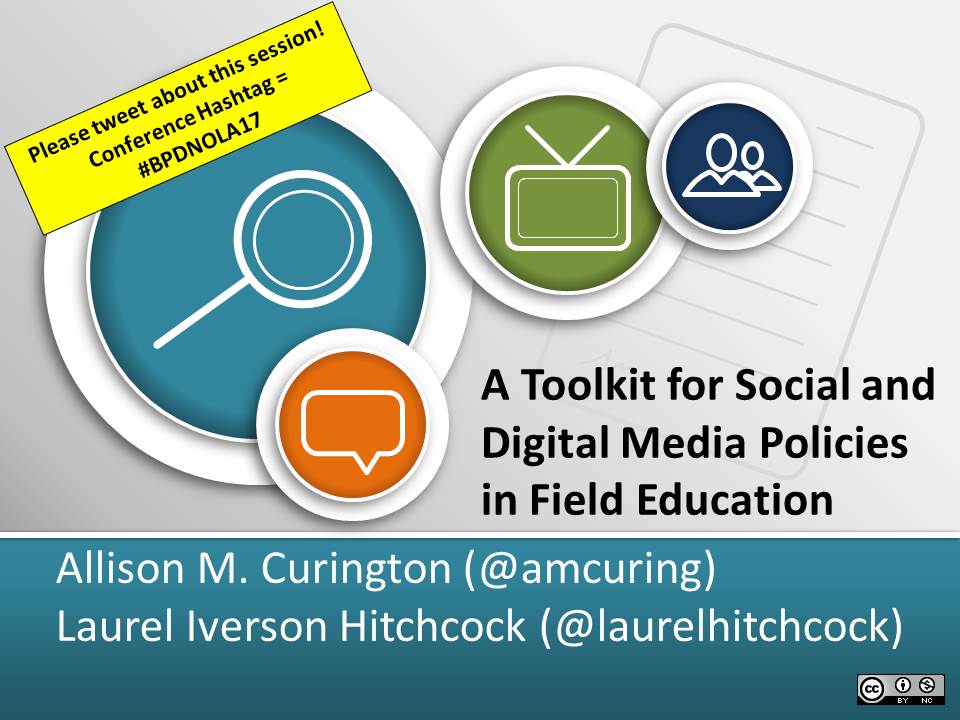 In November 2016, I had the pleasure of presenting with Allison Curington, Director of Field Education at the University of Alabama, about our Social Media Policy Toolkit at CSWE’s 2016 Annual Program Meeting in Atlanta, GA. Today, we are at BPD’s 2017 Annual Conference in New Orleans to share our work once again. We will be talking about a project that we have been working on for the past two years, a Toolkit for Social and Digital Media Policies in Field Education. Please join us at 11:00 AM in Bayside B at the Sheraton in New Orleans for our presentation. Allison and I started collaborating on this toolkit after many, many conversations about the growing use (and misuse) of social media in field education by students, educators and field supervisors. We saw that field directors were increasingly dealing with ethical and practical issues related to the use of social and digital media in field education, and we wanted to provide information and tools to help field directors raise awareness with students and field supervisors.
Based on feedback from CSWE and a Field Educator’s training at UA in January, we have updated our tools and hope to get even more feedback from our BPD colleagues before launching our toolkit. In our interactive workshop today, we plan to present on the toolkit and share one of the tools from the kit – Social Media Policy Checklist and Worksheet for Social Workers.

Teaching & Learning in Social Work by Laurel Iverson Hitchcock is licensed under a Creative Commons Attribution-NonCommercial-ShareAlike 4.0 International License